
In my last post (Incremental Fetch for Graphs) I talked about how incremental data fetch for tables now works for graphs also. What I forgot to add was how this behavior works for totals only graphs.
In my graph options I now change my plotting option from "Data only" to "Totals only".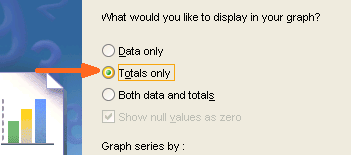 And I have two totals defined - one for each of my data points: Profit SUM and Sales SUM. These are grand totals, so that they will display only once at the end of the table.
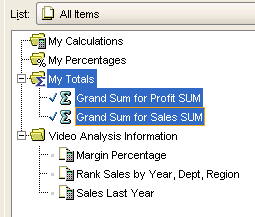 And of course, I have my incremental fetch value set to 50 rows, so that when I run my worksheet it fetches only the first 50 rows of data. The graph does not display any... well.. graph... because the totals have not yet been displayed.
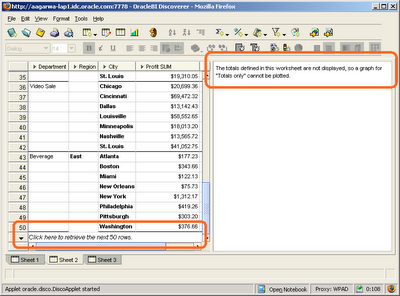 If I retrieve all rows into the worksheet, I get to see my totals at the end of the table, and the graph now shows a pie chart, with one slice for the Profit SUM total and the other slice for the Sales SUM total.
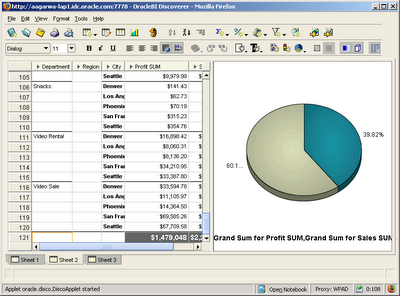
Friday, June 20, 2008
Incremental fetch for graphs - totals only graphs
Subscribe to:
Post Comments (Atom)
No comments:
Post a Comment